I was cleaning out my closet this weekend and happened to come across some old books. In addition to accounting and economics textbooks long forgotten, I came across some paperbacks spanning a range of business topics. Included in the mix was the book Barbarians at the Gate: The Fall of RJR Nabisco by Bryan Burrough and John Helyar. The book discussed the leveraged buyout of RJR Nabisco during the 1980s. I think the book was required reading in one of my business strategy courses and I wrote a case study on the book. What struck me was how the title aptly describes the U.S. economic environment today. The barbarians at the gate are inverted yield curves, a manufacturing slowdown, the trade war with China, and overall global economic weakness. So far, the barbarians have been held at bay by countervailing forces such as a strong labor market, robust consumer spending, and accommodative monetary policy. The question as we move forward is which force will ultimately prevail? In addition to discussing the state of the U.S. economy, this article will also take a technical look at several of the major U.S. equity market indexes.
One of the major topics of concern is the inverted yield curve. An inverted yield curve occurs when the interest rate on short-term debt exceeds the interest rate on long-term debt, typically the 3-month or 2-year yield vs. the 10-year yield. Historically, an inverted yield curve has been a harbinger of recession with an inverted curve preceding all 9 recessions since 1955. The only exception is the inversion that took place in the mid-1960s that did not result in recession, although the curve did invert again in the late-1960s preceding the recession of 1969/1970. Based on historical data, the lead time from an inversion to a recession is anywhere from 6 months to 2 years. Below is a graph showing the yield spread for three measures followed – Effective Federal Funds Rate (EFFR)/10-year, 3-month/10-year, 2-year/10-year – for the period January 1, 2018 to August 22, 2019.
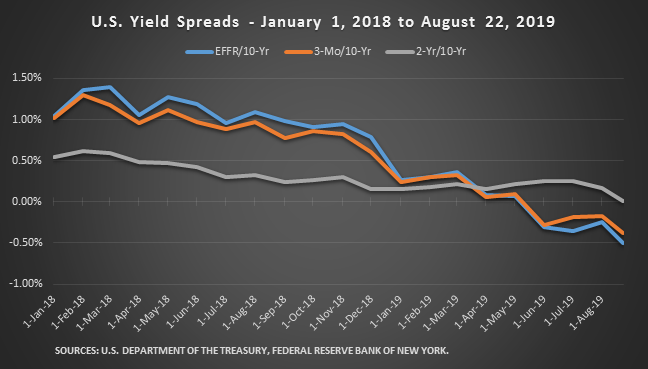
As the graph demonstrates, the EFFR/10-year and 3-month/10-year spreads have been inverted since May 2019, with the spread widening most recently. The 2-year/10-year spread inverted temporarily over the past couple of weeks with the spread positive as of August 22, 2019 (.01%). Looking at the graph, a couple of things are evident. First, long-term rates (10-year) have been declining more precipitously than short-term rates (EFFR & 3-month). One explanation for this could be that the Federal Reserve (Fed) is holding the Federal Funds Rate (FFR) too high given both the existing state of the economy and the future outlook according to the bond market (recessionary outlook). This is plausible given the trade war and the strains being placed on the U.S. economy. To correct this situation, the Fed needs to reduce the FFR more aggressively to both lower short-term interest rates and stimulate the economy. We believe additional reductions in the FFR will be forthcoming. Another explanation is a “flight-to-safety” in the 10-year Treasury. Given the slowing economic backdrop, coupled with uncertainly created by the trade war, investors are flocking to the safety of 10-year Treasuries. This “flight-to-safety” is pushing the 10-year yield down and inverting the EFFR/10-year and 3-month/10-year spreads. However, should the situation improve (fears prove unfounded), the 10-year yield will increase thus steepening the yield curve. One final factor that might be placing downward pressure on the 10-year yield is foreign investors attracted to the relatively higher yields offered on U.S. Treasuries. This is plausible, although foreign buying doesn’t appear to be the major reason for the decline in the 10-year yield (and yield curve inversion). The U.S. economy is slowing and there is a lot of concern surrounding the future trajectory of trade negotiations.
The second thing that is evident looking at the graph is that given recent trends, all three yield spread measures will invert shortly. This is not a good development with potentially adverse economic consequences for the U.S. economy. Inverted yield curves have the potential to distort economic and financial decision making. Moreover, talk of an inverted yield curve with the potential for a recession may negatively affect business and consumer confidence. Through behavioral channels, talk and worry about a recession may eventually produce a recession, i.e., a self-fulfilling prophecy.
Taking a step away from the U.S. economy for a moment, the major U.S. equity market indexes have been holding up fairly well. Despite the negative headlines and day-to-day volatility, the major U.S. equity market indexes are still within striking distance of all-time highs.
I) Dow Jones Industrial Average (DJIA)
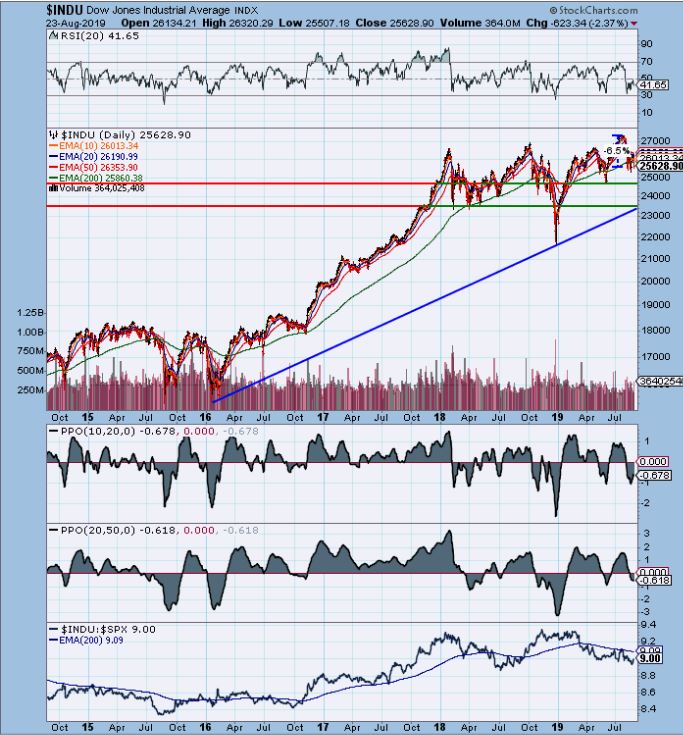
The Dow Jones Industrial Average (DJIA) is approximately 6.5% below its all-time high of 27,400. The DJIA has been in a choppy trading range over the last year and a half, bounded by 27,000 on the upside and approximately 23,500 on the downside (excluding the sharp decline and recovery in late-2018/early-2019). Looking at the chart, the index appears to want to move higher, but has been frustrated in its attempts by external factors, most prominently the trade war with China. Relative to the S&P 500, the DJIA has been underperforming in 2019. YTD, the DJIA is up approximately 10%.
II) Nasdaq Composite
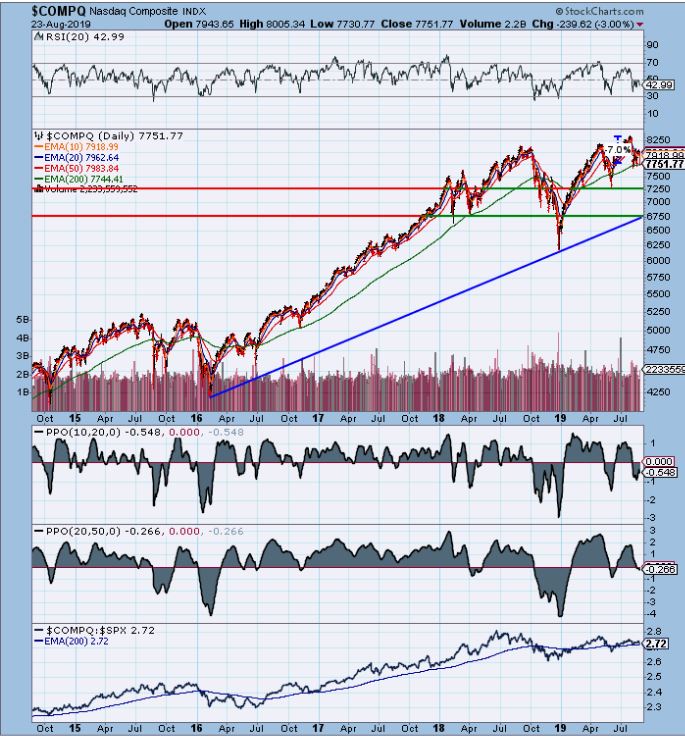
The Nasdaq Composite is approximately 7% below its all-time high of 8,339. The Nasdaq has been a strong performer throughout this entire bull market (along with technology stocks in general). Technically, the chart still looks good with an uptrend in place. What will be critical for the Nasdaq is how the trade war evolves. The Chinese markets are very profitable for companies such as Apple. On a relative strength basis, the Nasdaq has been in an uptrend vis-a-vis the S&P 500 over the last couple of years. Recently, performance has lagged given heightened volatility, but the longer term trend is still positive. YTD, the Nasdaq is up approximately 17%.
III) S&P 500
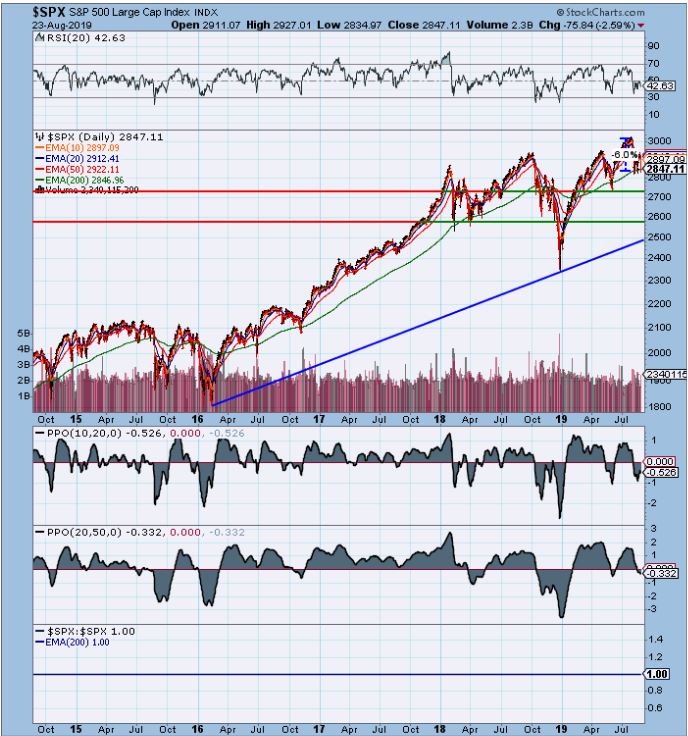
The S&P 500 is approximately 6% below its all-time high of 3,028. Similar to the DJIA, the S&P 500 has been in a choppy trading range with an upward bias. The 3,000 level on the S&P 500 has proven to be strong overhead resistance, not surprisingly. Similar to the DJIA, attempts by the S&P 500 to move higher have been thwarted. A sustained move past 3,000 will require at least a de-escalation in the trade war with China along with a pickup in corporate and economic data. YTD, the S&P 500 is up approximately 13.5%.
As noted in the introduction, the barbarians are at the gate. The inverted yield curves, softening economic data, escalating trade war with China, and global economic weakness present significant challenges to the U.S. economic expansion and bull market in equities. As for the trade war with China, it is very difficult to evaluate how this situation will evolve and what the overall ramifications will be for the global economy. Just last week, China imposed tariffs on an additional $75 billion of U.S. goods scheduled to take effect on September 1st and December 15th. President Trump responded in kind by raising the existing tariff level on Chinese goods currently tariffed and proposed to be tariffed by 5% (25% to 30% & 10% to 15%). Moreover, President Trump wants U.S. companies to leave China entirely. While this option appears extreme and unlikely, it speaks to the current state of affairs. If the situation with China continues to deteriorate, it is possible the U.S. economy could slip into recession. On the positive side, the services sector still appears to be healthy with consumer spending holding up well. The labor market is still strong, and the unemployment rate is low. The Conference Board’s Leading Economic Index (LEI) increased slightly to 112.2 in July (all-time high). As for the Fed, the FFR was recently reduced by .25% and the probability is high that we will see more reductions going forward. And lastly, as highlighted above, the major U.S. equity market indexes have not declined that much and are still within striking distance of all-time highs. Based on the data at this point, the probability of a U.S. recession in the near term still appears to be low. However, equity markets will most likely remain volatile with large daily swings based on trade developments. Ultimately, the outlook hinges on trade negotiations. We will continue to monitor developments and adjust accordingly.
Raskob Kambourian Financial Advisors is an independent, fee-only comprehensive financial advisory firm registered with the Securities and Exchange Commission. We offer expertise, competitive pricing, and personalized financial services to meet your “Life Planning” needs.